Drivetrain Loss Calculator: Estimate Wheel Horsepower
Use a drivetrain loss calculator as a quick check: estimate wheel horsepower as crank hp × (1 − loss), with drivetrain loss commonly estimated at about 10–15% for manuals, 15–20% for automatics, and 20–25% for AWD. Miss this, and you can read a dyno sheet wrong, overstate power, or chase a problem that is really drivetrain drag and dyno setup. This guide shows how to convert crank horsepower to wheel horsepower, estimate loss by drivetrain layout, and judge whether a result looks believable.
How is this calculated?
Press Calculate to see the math with your numbers.
What drivetrain loss means
Drivetrain loss is the power lost between the engine and the wheels, usually expressed as a percentage. The drop comes from friction, heat, and mechanical inefficiency in parts such as the transmission, driveshaft, differential, axles, and related hardware. Crank horsepower is engine power before that loss. Wheel horsepower is what the dyno measures at the rollers.
Crank horsepower versus wheel horsepower
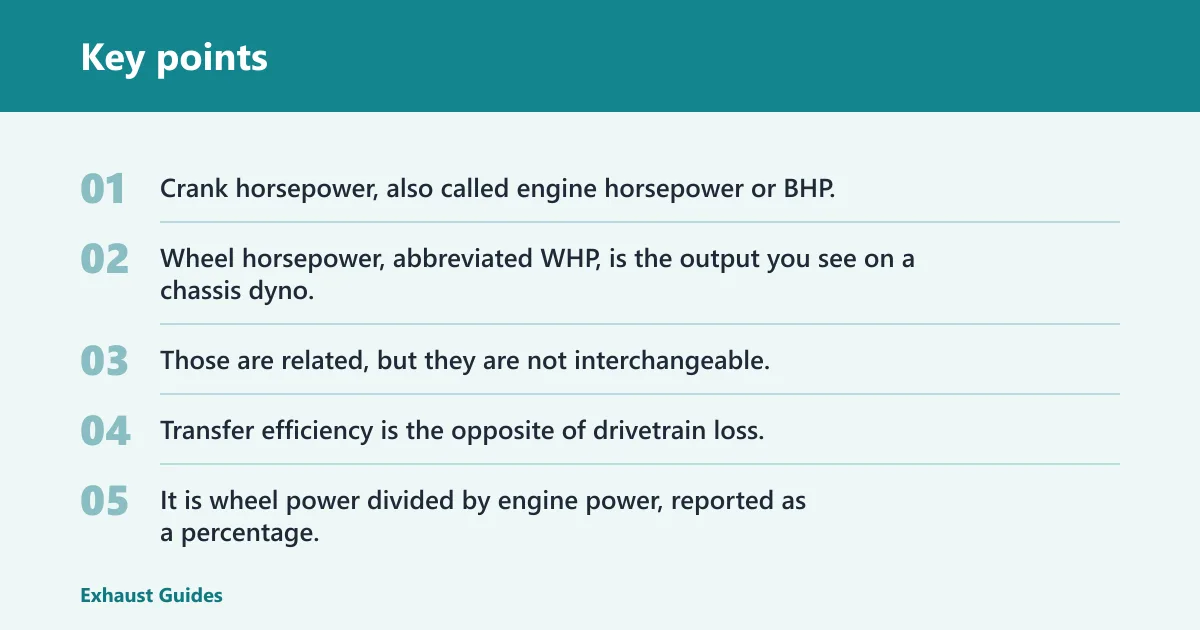
Crank horsepower, also called engine horsepower or BHP, is the input you use when you start from a factory rating or an engine dyno number. Wheel horsepower, abbreviated WHP, is the output you see on a chassis dyno, or the value you work backward from if you already know the wheels number and want an estimated crank figure. Those are related, but they are not interchangeable.
Transfer efficiency and why it matters
Transfer efficiency is the opposite of drivetrain loss. It is wheel power divided by engine power, reported as a percentage. If an engine makes 300 hp and the wheels show 255 hp, transfer efficiency is 85%, while drivetrain loss is 15%. That difference matters when you compare cars with different layouts or dyno methods.
How the calculator works
The calculation is straightforward, but the result is still only an estimate. One calculator uses DL = (EHP – WHP) / EHP × 100, where EHP is engine horsepower and WHP is wheel horsepower. The reverse calculation uses the same logic: wheel horsepower equals crank horsepower multiplied by one minus the loss fraction.
Reverse calculation from crank hp to wheel hp
- Pick a loss percentage that matches the drivetrain layout and transmission type as a starting point.
- Convert the percentage to a decimal. For 15%, use 0.15.
- Subtract that decimal from 1.00.
- Multiply crank horsepower by the result.
For example, 300 crank hp at 15% loss gives 255 wheel hp. That matches a published example that states 300 horsepower and 255 wheel horsepower equals 15% drivetrain loss, and another example that estimates 255.00 WHP from 300 BHP at 15% loss.
Why the answer is an estimate, not a certificate
Factory ratings and dyno sheets do not make drivetrain loss fixed. SAE J1349 is commonly used as a net engine power standard for certified crank ratings, and SAE J2723 is a witness-testing procedure associated with certified crank ratings. Even with those references, the path from engine to wheels still depends on the layout, the transmission, and the test method.
Typical drivetrain loss by layout
A common rule of thumb is about 10% for FWD, about 15% for RWD, and about 20% for AWD, with some 4WD setups around 22%. Those baselines are useful for a first pass, but they are not fixed facts for every vehicle. Transmission type can move the estimate up or down.
How transmission type changes the range
Manual, automatic, DCT, and CVT do not lose power the same way. AxisCalc notes a common manual-versus-automatic assumption as a +5% automatic-transmission add-on, which is why many estimates put automatics above manuals. DCTs can be efficient in some conditions, while CVTs can behave differently again because their ratio control and belt or chain losses do not match a stepped gearbox.
For reference, a common estimate set is FWD about 10%, RWD about 15%, AWD about 20%, and sometimes 4WD about 22%. Another source lists base loss around 10% for FWD, 13% for RWD, and 18% for AWD. That spread is one reason a calculator should screen a result, not declare it final.
Does dyno type change the result?
Yes. Chassis dyno versus engine dyno can change the reported WHP, and that changes the calculated loss. Run conditions matter too, because tire pressure, strap load, gear choice, temperature, and test repeatability can move the number enough to make cross-dyno comparisons misleading. A drivetrain-loss estimate is only as good as the measurement behind it.
Chassis dyno versus engine dyno
A chassis dyno measures power at the rollers, so it captures drivetrain losses in the result. An engine dyno measures at the crank, so it bypasses most of the drivetrain path. If you compare a crank number from one setup with a wheel number from another, the percentage can look wrong even when both measurements are valid.
Run conditions that move the number
Heat soak, tire slip, tie-down force, and the gear used for the pull all affect the result. Two chassis dyno runs on different machines can produce different WHP even if the car has not changed. That is why a drivetrain loss calculator should be used to sanity-check a figure, not to prove a precise loss value across every dyno.
Drivetrain sanity-check table
| Drivetrain layout | Transmission type | Typical loss range | When the estimate breaks down | What measurement evidence to trust instead |
|---|---|---|---|---|
| FWD | Manual | About 10% | High-slip tires, mismatched gear ratios, or a chassis dyno run in a poor gear | Repeatable runs on the same dyno, same gear, and similar tire pressure |
| FWD | Automatic or CVT | 10-20% | Torque-converter slip, shift logic, or CVT ratio behavior changes the result | Dyno sheets from the same dyno under the same control settings |
| RWD | Manual | About 15% | Very short final drive, tire growth, or a vehicle with unusual driveline drag | Factory crank rating, same-day wheel runs, and the dyno’s correction method |
| RWD | Automatic or DCT | 15-20% | Converter slip, clutch control, or launch-related heat can distort the pull | Back-to-back runs on one dyno, with notes on gear and temperature |
| AWD | Manual, automatic, or DCT | About 20% or 25% | Center differential behavior, torque split, or drivetrain mode changes | Same-mode runs, same dyno, and published correction factors from the sheet |
| 4WD | Automatic or manual | About 22% | Part-time engagement, transfer-case drag, or roller setup differences | Test notes that show driveline mode, rollers used, and repeatability |
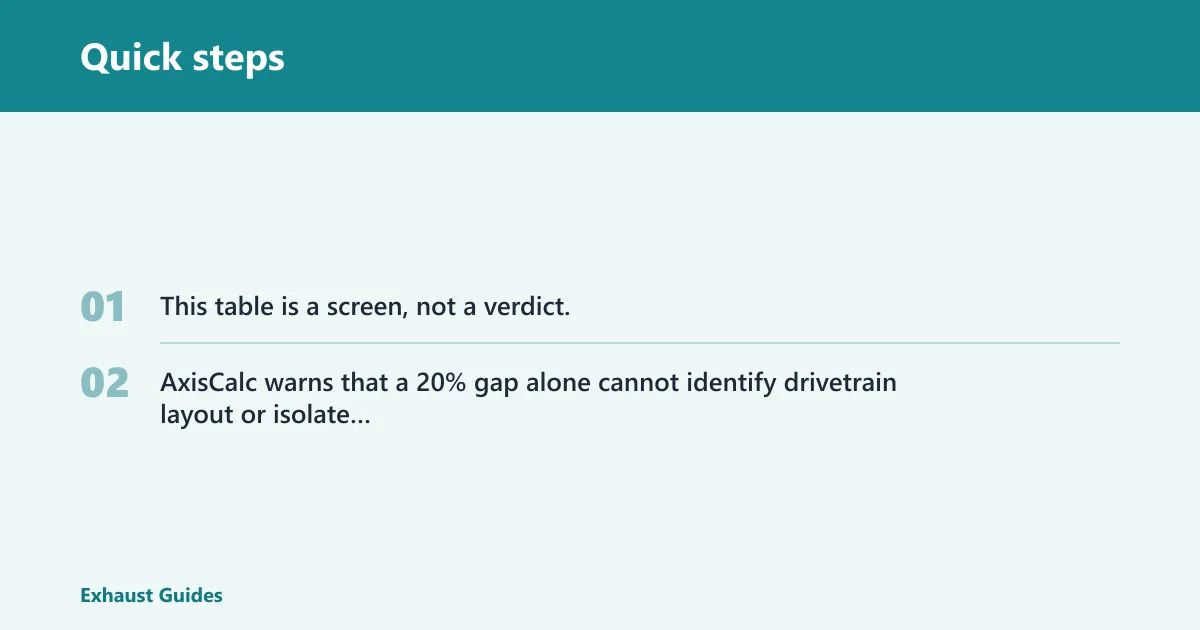
This table is a screen, not a verdict. AxisCalc warns that a 20% gap alone cannot identify drivetrain layout or isolate frictional loss, and that point matters when you are looking at mixed dyno data.
Why your number looks off
When the result looks high or low, the usual cause is not one single percentage. Transmission behavior, dyno type, and the vehicle’s layout all matter at once. A manual can show less apparent loss than an automatic because the converter or shift strategy in the automatic adds drag or slip under load. AWD does not always lose more than RWD, either, because the specific transfer case, center differential, and operating mode can shift the measured result.
Common reasons loss runs high
Loss can look higher than expected when the dyno uses a different correction method, the car is tested in a poor gear, or the wheels slip on the rollers. Heat, fluid temperature, worn bearings, dragging brakes, and sticky AWD hardware can also push the number upward. On some setups, a DCT can look very efficient in one mode and less so in another.
Suppose a turbo sedan is rated at about 320 crank hp and shows about 250 WHP on one chassis dyno. That is a 21.9% loss estimate, which may be believable for AWD if the run was hot and the dyno was loaded heavily. If the same car then shows 280 WHP on a different dyno, the “loss” is not suddenly fixed; the test method changed.
A common first-timer mistake is treating a single percentage as a vehicle fact. If the test setup changes, the number changes too. That is why drivetrain loss is better used as a screening tool than as a permanent label.
Red flags to check first
Start with the obvious failures. WHP higher than crank hp can happen on a dyno sheet, but it usually points to a mismatch in the rating standard, a correction difference, or a comparison between unlike tests. Impossible percentages, such as negative loss or extremely large loss from a normal street car, should make you inspect the inputs before you trust the output.
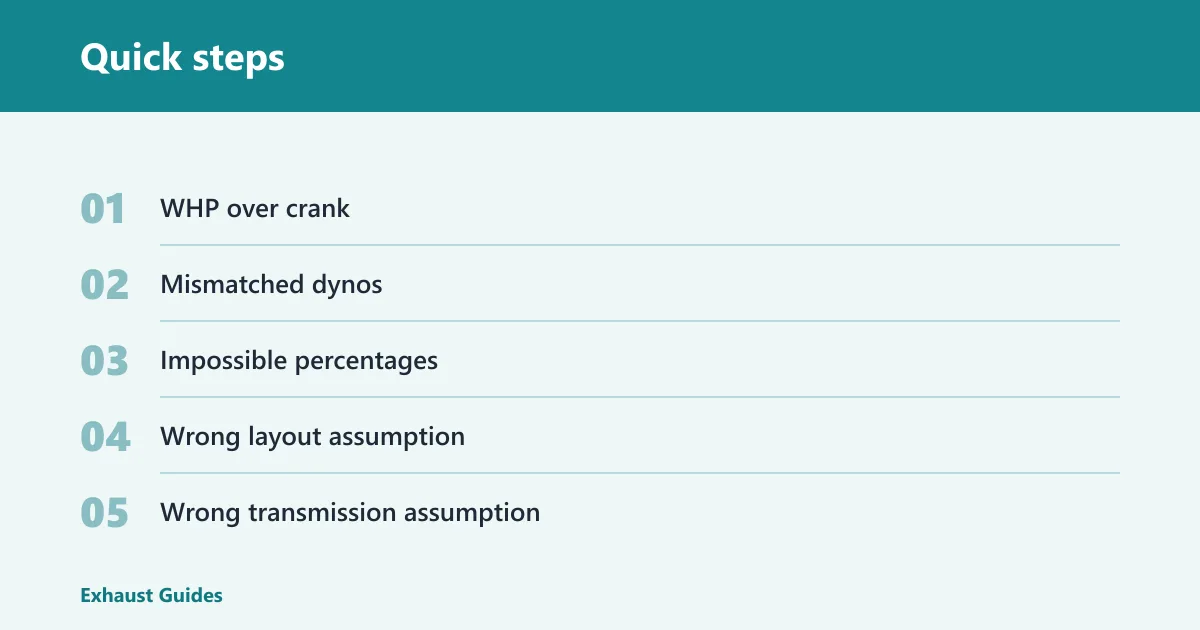
- WHP over crank — check whether the crank rating came from SAE J1349, a different standard, or a rounded brochure figure.
- Mismatched dynos — do not compare a chassis dyno pull with an engine dyno rating as if they were the same measurement.
- Impossible percentages, negative loss or a huge loss on a healthy stock vehicle usually means the inputs, correction factor, or units are wrong.
- Wrong layout assumption, a car that is actually AWD or 4WD will not fit a FWD or RWD rule of thumb.
- Wrong transmission assumption, automatic, DCT, and CVT behavior can shift the estimate enough to change the result.
Picture a 2.0-liter hatchback rated at 250 crank hp that records 260 WHP on a chassis dyno. That does not mean the car is broken. It usually means the crank figure is conservative, the dyno is reading high, or the comparison mixes different standards and conditions.
Frequently asked questions
What is drivetrain loss?
Drivetrain loss is the power lost between the engine and the wheels, expressed as a percentage. Friction, heat, and mechanical inefficiency in the transmission, driveshaft, differential, axles, and related parts all contribute. It is best treated as an estimate that helps you compare crank and wheel numbers.
How do you calculate drivetrain loss from crank hp and wheel hp?
Use DL = (EHP – WHP) / EHP × 100. Subtract wheel horsepower from crank horsepower, divide by crank horsepower, then multiply by 100.
What is a typical drivetrain loss for FWD, RWD, and AWD?
A common rule of thumb is about 10% for FWD, about 15% for RWD, and about 20% for AWD, with some 4WD setups around 22%. Those figures are useful as a starting point, but transmission type, dyno type, and condition can move the result.
Is drivetrain loss a fixed percentage or does it vary by dyno?
It varies. A chassis dyno measures wheel power, while an engine dyno measures crank power, so the comparison changes with the test method. Different dynos, correction factors, gears, and run conditions can shift the number enough that a fixed percentage is only a rough screen.
Why does my automatic show more drivetrain loss than a manual?
Automatics often show more apparent loss because the torque converter, hydraulic controls, and shift behavior add drag or slip under load. The same source notes a common manual-versus-automatic assumption as a +5% automatic-transmission add-on, which is why automatics are often estimated higher than manuals.
What should I do if my measured wheel horsepower is higher than expected?
Check the crank rating standard, the dyno type, the correction method, and whether the pull used the right gear. WHP higher than crank hp is not impossible on paper, but it is a sign to verify the test setup first. Treat the number as a comparison point, not a final verdict.